 Index
Index
- Bird Line Sections
- Comparisons
- Contact Information
- Custom Meter Scales
- Customizing MB-1
- Documentation
- Downloads
- Expansion Features
- Evaluating Analog Meters
- Evaluating Couplers
- FAQ
- Features
- Generic Meter and RF current Measurements
- Hardware Diagnostics
- Interfacing your own Analog Meters
- Interfacing your own Couplers
- Multi-Coupler Display Feature
- Prices
- Programming MB-1
- Projects
- Quick Reference Guide - Menus
- Quick Reference Guide - Switches and LEDs
- Recent Site Updates
- Reviews
- Specifications
- Simulator
- Troubleshooting
- Useful Links
- Using Different Couplers
- Utilities
- Videos
Programming MB-1
To modify most meter settings, you need to follow two simple steps:
- Select the menu for the item you wish to control. Do this by
pushing the Menu DOWN Scroll button or Menu UP Scroll button shown below. Each of
the 19 available menus will scroll in alphabetical order on the bottom
line (line 4) of the LCD.
Release the scroll button when the desired menu is displayed. A
single push of the UP or DOWN Scroll button will advance
to the next menu, or move back to the previous menu if you overshoot
using the UP or DOWN scroll buttons.
When you become more familiar with the meter, you can use the lower row of buttons, referred to as "Shortcut buttons", to bring up most of the commonly used menus with a single button push. This is discussed in more detail below.
- When the desired menu is displayed on line 4 of the LCD as shown
below (Panel Meter menu shown), press
one of the four menu buttons, M1 through M4 to modify the first
through fourth menu items on line 4, as read from left to right on
line 4 of the LCD.
This will
modify the setting associated with that menu button.
Example - Controlling the Panel Meter
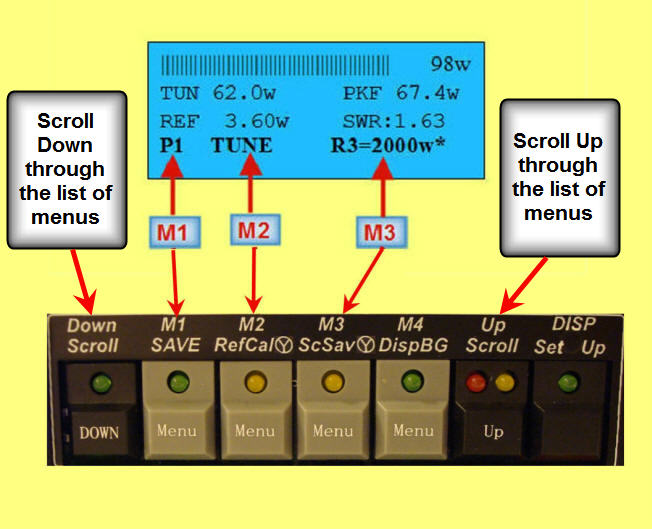
The example above shows the menu that controls the Analog Panel Meter
functions. Menu buttons M1 - M3 correspond to the three positional items,
as read from left to right,
on line 4 of the LCD. (Menu items are separated on line 4 of the LCD by one or more
spaces.)
Each push of a menu button will select the next available choice for that
option.
-
In this example, menu button M1 selects the Panel Meter. (MB-1
supports external analog meters in addition to the built-in
crossneedle meter). Panel meter 1 (P1) , which is the
internal crossneedle meter, is selected in the
above example. If
you have not added any additional external analog meters, P1 will be your only choice. As you add additional meters,
this menu will automatically adapt to allow you to select the
additional analog meters you have added.
-
M2 selects the measurement type you want to display on the selected Panel
Meter. TUNE (Instantaneous) power is selected in the above
example. Each press of
M2 cycles through the other
measurement types that can be displayed on the analog meter (e.g.,
Peak Power, Average Power, Delivered Power, Min and Max functions,
etc.).
-
M3 selects the Panel Meter manual range. In the above example, the
third range (currently set at 2000 watts) is being controlled by the AutoRange
function (the asterisk indicates that the Panel Meter AutoRange
function is on, and is therefore controlling the range based on the
magnitude of the signal being measured). Pressing M3
will
turn the AutoRange function off and will select the lowest range that
the panel meter was calibrated at when it was set up during
calibration. Subsequent presses of M3
will select successively higher ranges with wrap-around.
- Since the Panel Meter menu has only three options corresponding to the three fields on the line 4 menu, menu button M4 is not used with this menu.
Example - Controlling the Bar Graph
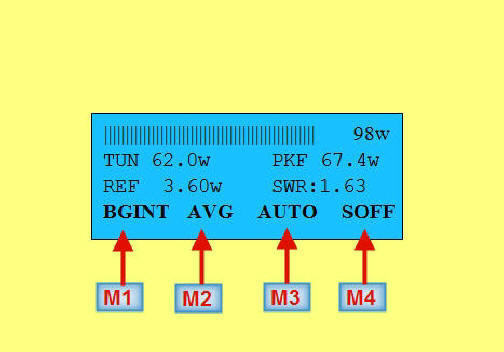
The example above shows the menu that controls the Bar Graph functions. Menu buttons M1 - M4 correspond to the four positional items on the menu line (line 4) of the LCD that can be used to control the Bar Graph.
As with the Panel Meter example above, each push of a menu button selects the next available choice for that option.
-
Menu button 1 (M1) selects the Bar Graph device that the selected
measurement is displayed on (BGINT
= internal Bar Graph, which is displayed on Line 1 of the LCD). The other choices for this option are BGEXT
(the external Hi Visibility LED bar graph module), BGBTH
(both the internal and external bar graphs are driven simultaneously), and NONE (Bar Graph
display is turned completely off).
-
M2 selects the measurement type you want to display on the Bar Graph (AVG
- Average power is selected in the above example). As with the Panel
Meter example above each press of this button cycles through the
other measurement types that can be displayed on the Bar Graph meter
(e.g., Peak Power, Average Power, Delivered Power, Reflected Power,
SWR, Min and Max functions, etc.).
-
M3 selects the bar graph manual range. In the above figure, the Bar
Graph is in the
AutoMax
mode. Pressing M3 will turn off the AutoMax
function and will select the lowest range that the bar graph was
programmed at. When a manual range is selected, the third field on
the menu line (currently set to AUTO) will display the
numeric value of the range. Subsequent presses will select successively higher
ranges with wrap-around.
- M4 toggles the Bar Graph sticky bar on and off. The sticky bar keeps the maximum illuminated segment on for user programmed duration. (SOFF = Sticky Bar OFF in the above example).
Saving All of the Meter Settings to a Configuration Set
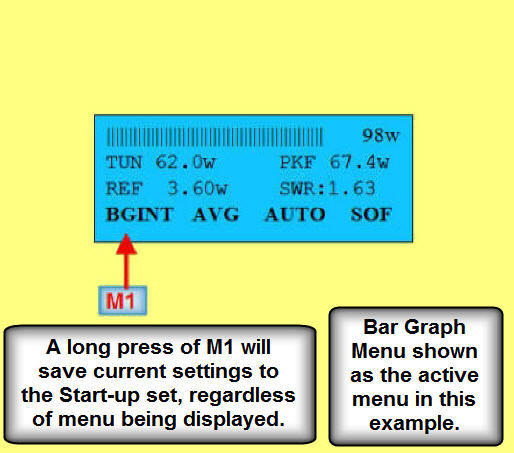
At any point, you can save the current state of all meter settings to the Startup Configuration Set. You typically will do this once you have configured the meter with your preferences, such as the devices you want various measurement types to be displayed on, the desired coupler and analog meter you want to use with the Startup set, peak hold settings, and the like. Once saved, these settings will be automatically restored each time the meter is powered up. Saving the meter settings to the Startup Set is easily accomplished with a long press of Menu button M1, and can be done regardless of the current menu being displayed on line 4 of the LCD. A confirmation message on the LCD will confirm successful storage of the settings to the Startup Set.
Including the Startup Set, there are a total of seven configuration sets (six user-defined sets and one factory default set).
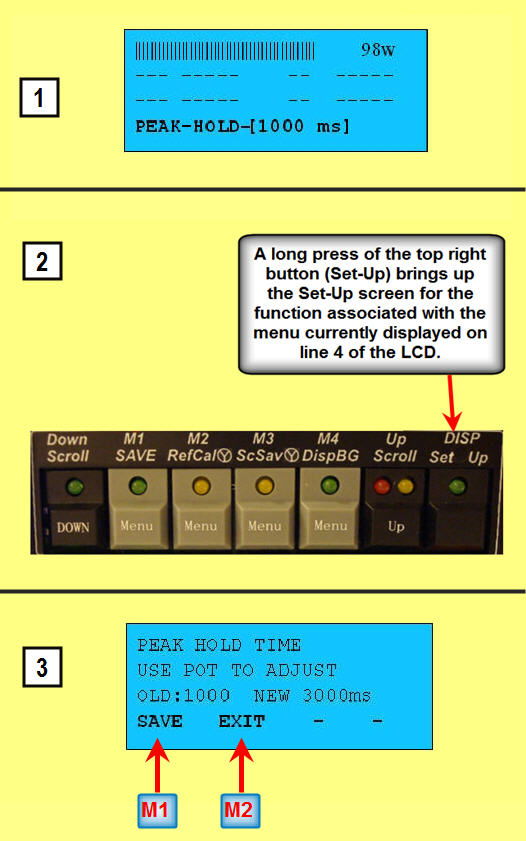
Modifying Meter Settings - Example 1: Peak Hold Time Example
To modify a meter parameter, such as the peak hold time:
1. Bring up the menu associated with the parameter you want to modify on line 4 of the LCD. For example, to modify the Peak Hold time, the Peak Hold menu would be selected as shown in the first LCD screen below.
2. Apply a long press to the Setup button Set-Up, which is the top right button on the front panel. This brings up the Setup screen which is the second LCD screen shown below (insert 3).
3. Dial-in the NEW desired Peak Hold value (100ms to 9900 ms in 100 ms increments) using the front panel pot.
The OLD value in the second LCD screen below is the current value of the peak hold parameter. The NEW value will change as you turn the front panel pot. When the desired value is dialed in, press M1 to SAVE the new value and exit the setup screen. The value becomes effective immediately. Press M2 if you want to EXIT without saving the changes.
In the example below, the peak hold time is being changed from 1000 ms (the current (or OLD) value) to 3000 ms (the NEW value).
Modifying Meter Settings - Example 2: Averaging Filter Example
The following shows another example - setting the Averaging Filter parameters. These control the digital filtering parameters for computing average power. As with any Setup function, first bring up the menu on line 4 of the LCD that is associated with the parameter you want to modify (the AVFLT menu in this example - not shown below).
With the Averaging Filter menu selected on line 4, the following three screens will appear in sequence after the Set-Up button is pressed. Menu buttons M1 - M4 are used as described above to select the positional items on the line 4 menu. Instructions are incorporated into the screens to simplify setup.
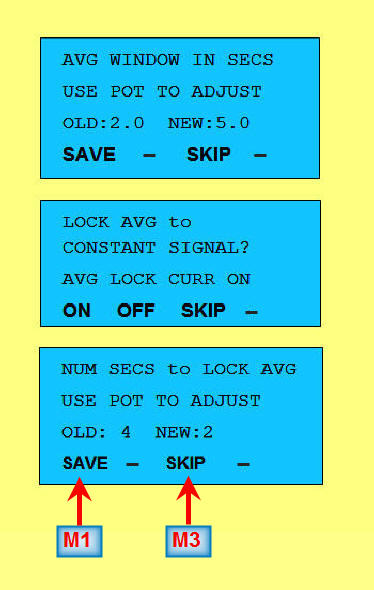
Tip: As in the above example, many of the Set-Up screens have a SKIP option, that when pressed, keeps the current setting, and advances the setup screen to the next option. The SKIP button is always M3 (menu button 3) on all setup screens that offer a SKIP option. Keep this in mind when using the setup screens. This will allow you to quickly advance through multi-page setup menus by repeatedly pressing the SKIP option until you advance to the option(s) you want to change.
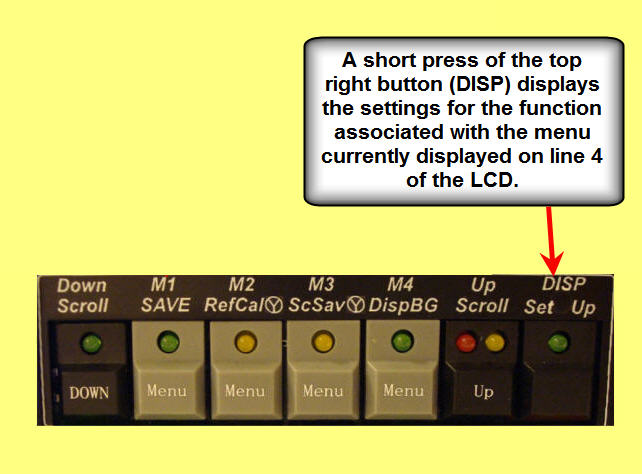
Displaying Settings
MB-1 gives you the ability to examine most meter parameters in a read-only mode without the need to activate the Setup screen. To display the settings for a particular meter function in a read-only mode, first bring up the applicable menu on line 4 of the LCD. Then press the Display button DISP (short press). The DISP button is the top right button on the front panel.
The Averaging parameters that were set in the above example are being displayed below.
Display of Averaging Filter Parameters (Read-Only mode)
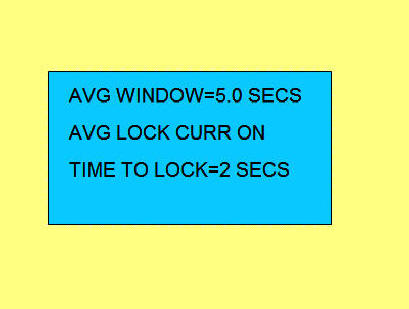
Some of the Display functions have more than one screen of information. For these functions, simply push the Display button repeatedly (short press) to advance to each subsequent screen. After the last screen is displayed, the meter will return to normal operation.
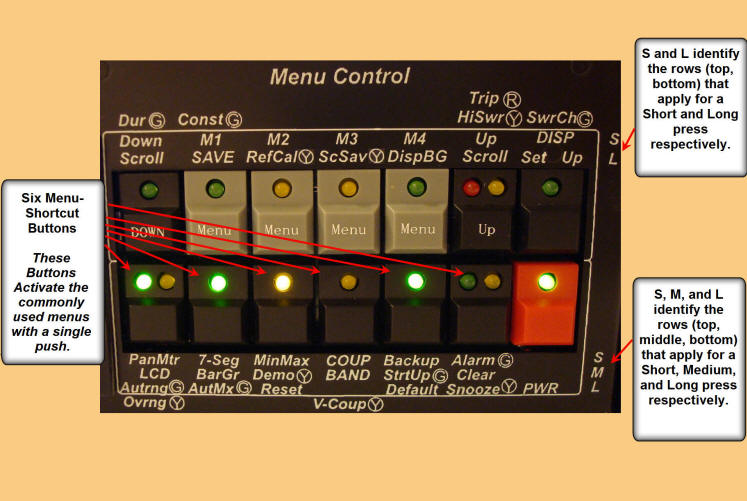
Shortcut Buttons
MB-1 gives you "single press" access to the commonly used menus. Use these buttons to directly access a desired menu without the need to scroll through the entire set of menus with the Scroll Up and Scroll Down buttons.
The shortcut buttons are the bottom row of switches as shown below. These buttons are multi-function buttons depending upon the duration the button is pushed. For example, the bottom left button provides one of three functions:
- Short Push - Brings up the Analog Panel Meter Menu on line 4 of the LCD.
- Medium Push - Brings up the LCD Display Menu on line 4 of the LCD. This menu controls the measurement items that get displayed on the LCD.
- Long Push - A long push of this button immediately activates the AutoRange mode of the Analog Panel Meter. (The AutoRange feature automatically selects the analog meter's range based on the current power level.) A confirmation is displayed on the LCD to confirm that the Panel Meter's AutoRange function is now on.
You do not have to memorize these functions. The text below each shortcut button indicates the function that gets selected for each of the three push intervals (Short, Medium, and Long).
The information on the silkscreen also shows you how to in interpret the Switch LEDS when illuminated. For example, below the bottom left switch, the Circled G to the right of Autrng indicates that the Green LED on that switch will be on when the AutoRange function is activated. As another example, the Circled Y to the right of Ovrng indicates that the Yellow LED on that switch will be on when an overrange condition occurs on the analog meter (i.e., the value being measured by the analog meter exceeds the analog meter's current full scale range). The overrange indicator is particularly useful when a manual range has been selected for controlling the analog meter.
Menu Shortcut Buttons
Recommendations for Mapping Measurements to Display Devices
Even though MB-1 allows you to map any
measurement to any display device, some display devices are
better suited than others for certain situations. The
following table provides some recommendations.
| Measurement Type | Analog Meter | Bar Graph |
Numeric Displays (LCD numeric values and 7-segment LED displays including External Displays) |
|
Instantaneous FWD Power Instantaneous Delivered Power Instantaneous Reflected Power |
Best for real time response. | Good for real time
response. Sticky bar allows you to easily see the
short term "peak" of the displayed measurement. Since the Bar Graph's full scale value is displayed, the Bar Graph can be used to provide a reasonable estimate of the actual value. |
Provides the most accurate measurement for key down conditions, such as when tuning an amplifier or tuner. |
|
Peak-FWD Power Peak-Delivered Power |
Good visual indicator. | Good visual indicator | Provides the most accurate Peak Power measurement. |
| Average FWD Power | Useful for seeing the real time affect of any change that modifies your average power (such as audio and compressor settings). | Useful for seeing the real time affect of any change that modifies your average power (such as audio and compressor settings). | Because of the damping factor provided by the filtering, a numeric display of average power provides the most accurate reading, even for time varying signals such as SSB or keyed CW . |
| SWR | Best for adjusting tuner or detecting "swings" in SWR. | Good for adjusting tuner or detecting "swings" in SWR. | Most accurate reading for stable SWR. |
| Min/Max Functions | Good visual indicator. | Good visual indicator. | Best for reading exact Min/Max value. |
Typical Settings
The following shows a reasonable starting point for setting up your MB-1 Displays. After familiarizing yourself with MB-1, set them based on your preference. The 7 configuration sets can be used to save different configurations based different operating conditions such as voice, CW, or data.
| Measurement Type | Setting | Comments |
| Crossneedle Meter | TUNE | Displays
instantaneous FWD power, Reflected power, and SWR. |
|
Bar Graph(s) |
AVG | Average Power - sticky bar on |
| LCD |
Default Settings as shipped with meter |
|
|
Seven Segment Displays |
||
| D1 | AVG | Average Power |
| D2 | PK-FWD |
If the PK-FWD mode is not currently selected, select it using the LCD configuration menu (field 2). The selected peak mode (PK-FWD or PK-DEL) is indicated in the peak power prefix on the right hand side of the line 2 display on the the LCD. |
| D3 | SWR | |
| D4 | MAXSWR |
Set up the Min/Max menu to capture SWR. Then select MAXSWR for display on D4 using the Digital (Seven Segment) Display menu. |
|
D5 (External 7-segment display 1) |
AVG
(for voice or data) PK-FWD (for CW) |
|
Quick
Reference Guide -
Front Panel Switches and LEDs
Quick Reference Guide - Menus