 Index
Index
- Bird Line Sections
- Comparisons
- Contact Information
- Custom Meter Scales
- Customizing MB-1
- Documentation
- Downloads
- Expansion Features
- Evaluating Analog Meters
- Evaluating Couplers
- FAQ
- Features
- Generic Meter and RF current Measurements
- Hardware Diagnostics
- Interfacing your own Analog Meters
- Interfacing your own Couplers
- Multi-Coupler Display Feature
- Prices
- Programming MB-1
- Projects
- Quick Reference Guide - Menus
- Quick Reference Guide - Switches and LEDs
- Recent Site Updates
- Reviews
- Specifications
- Simulator
- Troubleshooting
- Useful Links
- Using Different Couplers
- Utilities
- Videos
Miscellaneous Utilities
We will update this page periodically with utilities you might find useful. These are stand-alone utilities and do not require an MB-1.
SWR Plots using Excel
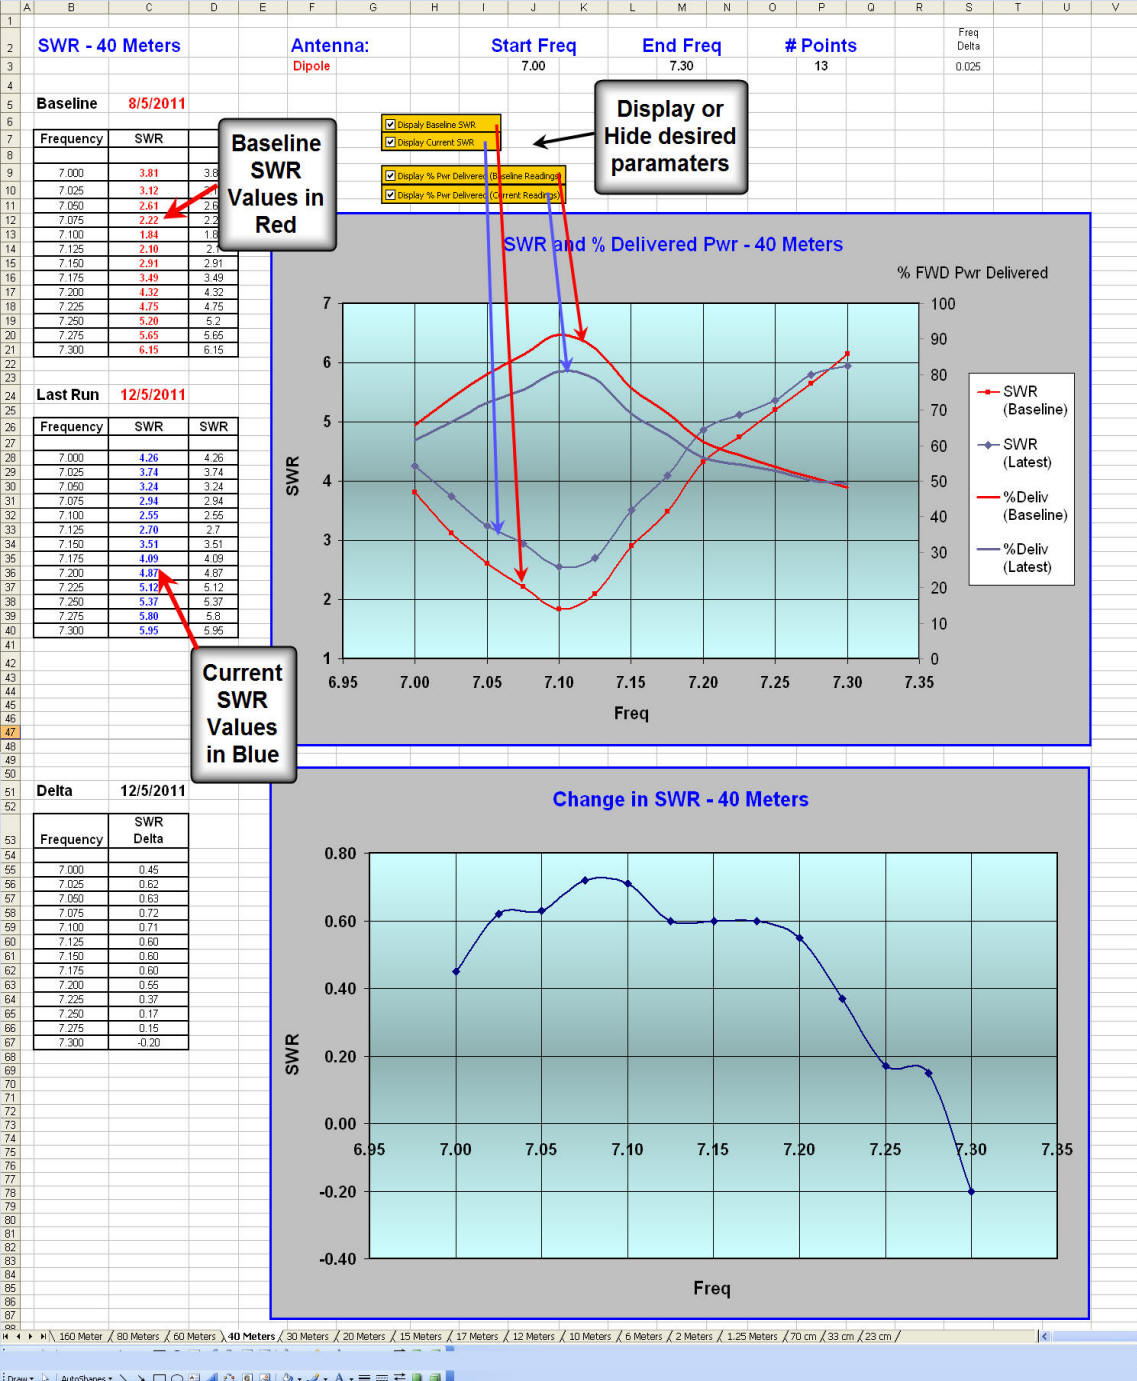
This utility provides a convenient place to manually record the SWR characteristics for all of your antennas. It takes only a couple of minutes to run the curves for each band and enter the SWR values in the spreadsheet. The generated graphs allow you to easily see if your antenna's center point or SWR has changed. The graphs are automatically generated as you enter the data into each worksheet.
The utility contains a worksheet for each of the amateur bands. The only data you need to enter are the measured SWR values (shown in red for the baseline run, and in blue for the current run). You can also enter the antenna type and dates of the runs if desired. The graphs will auto-scale to your values and will show you any deviations in SWR since your baseline measurements. You can also reformat the charts using Excel's standard formatting features if desired.
A graph of the baseline and current SWR values are displayed in the
top chart. The top chart also displays the percent of power
delivered to the load for the corresponding SWR graphs (assuming no
loss in the transmission line). The SWR data series are the ones
with the Excel markers. The percent power data series are the ones
without the markers. You can enable or disable display of any of the
four data series in the top chart by using the orange check boxes.
The bottom graph plots the difference between the baseline SWR and the current SWR values as a function of frequency.

